Performance Tables
Results 2025
Well done to all of our year 11 and 13 students this summer. We were thrilled to celebrate with you all.
Read more here and here to find out more about our results.
Performance Tables
The performance tables for 2025 are below. To compare Robert Clack School to other schools, please click here.
The DfE have advised that:
- Pupils/students included in this performance data will have experienced some disruption due to Covid-19 earlier in their schooling, which will have affected individual pupils and schools differently.
Primary Performance
We currently have Reception, Year 1, Year 2, Year 3 and Year 4 students in our primary school. The table below outlines the progress of our Reception students last year.
| Robert Clack | National Average | |
|---|---|---|
| Early Years Foundation Stage - Percentage of pupils reaching or exceeding the Good Level of Development | 69.5 | 67.7 |
| Key Stage 1 - Year 1 Phonics Screening - Percentage of pupils achieving Expected Standard (NA) | 88 | 81 |
| Key Stage 1 - Year 2 Phonics - Percentage of pupils achieving Expected Standard (NA) | 97 | 89 |
GCSE Performance
The data below relates to our 2025 GCSE results.


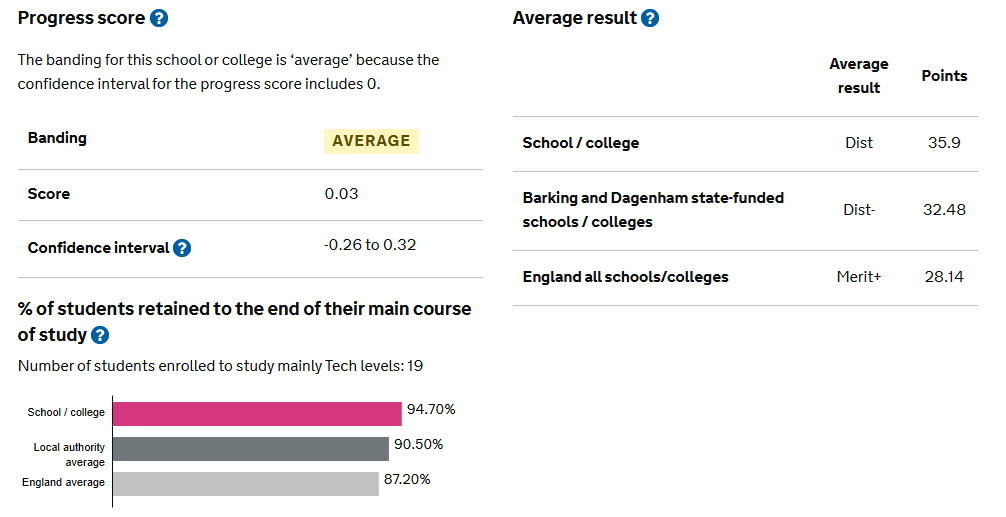
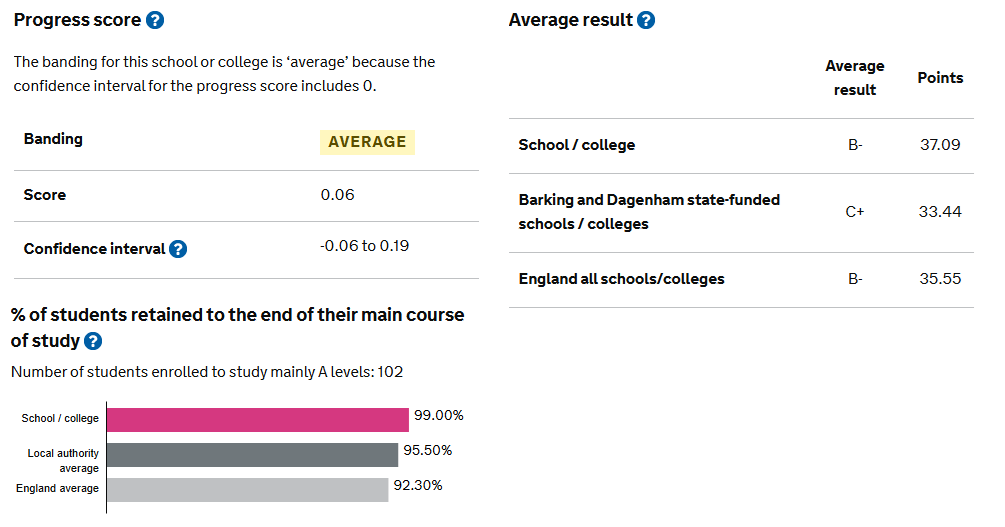
Post-16 Performance
The tables below relater to our 2025 results.
A Levels
Applied General Qualifications

Tech Levels